RxJS leak detection · dev only
Find leaked subscriptions before they ship.
One line in main.ts, a floating widget, a local dashboard. Works with any Angular dev-mode app. No Chrome extension.
npm install --save-dev rxjs-leak-finderimport { isDevMode } from '@angular/core';
import { Observable } from 'rxjs';
import { enableRxjsLeakDetector } from 'rxjs-leak-finder';
if (isDevMode()) {
enableRxjsLeakDetector(Observable);
}npx rxjs-leak-finder dashboard30 seconds
Record. Navigate. See the leak.
- Step 1 ● Recfloating widget, top-right
Press record
The floating widget on your app starts capturing every subscribe() with its stack and the active route.
- Step 2 → /products/products→/cart→/profile
Navigate around
Visit a route, leave it, visit another. The History API hook marks every route boundary in the session. Leaks start showing up the instant a route loses an open subscription.
- Step 3 ✓ LeakProductListPageasync-initproducts.page.ts:47:8
See leaks in real time
Leaks stream into the dashboard the moment you leave a route — no waiting. Hit Stop to freeze the full source-mapped report.
Leaks come in patterns. We classify them.
Each leak gets a kind so you know why it leaked — not just where.
nested-subscribeA subscribe() runs inside another subscribe(). Both leak.
outer$.subscribe(() => {
  inner$.subscribe(...);
});outer$.pipe(switchMap(() => inner$)).subscribe(...);async-initsubscribe() runs after await in async ngOnInit. takeUntilDestroyed() no-ops.
async ngOnInit() {
  await loadData();
  obs$.subscribe(...);
}ngOnInit() {
obs$.pipe(takeUntilDestroyed())
.subscribe(...);
}ng-initA bare subscribe() in ngOnInit with no teardown.
ngOnInit() {
  interval(1000).subscribe(...);
}ngOnInit() {
interval(1000)
.pipe(takeUntilDestroyed())
.subscribe(...);
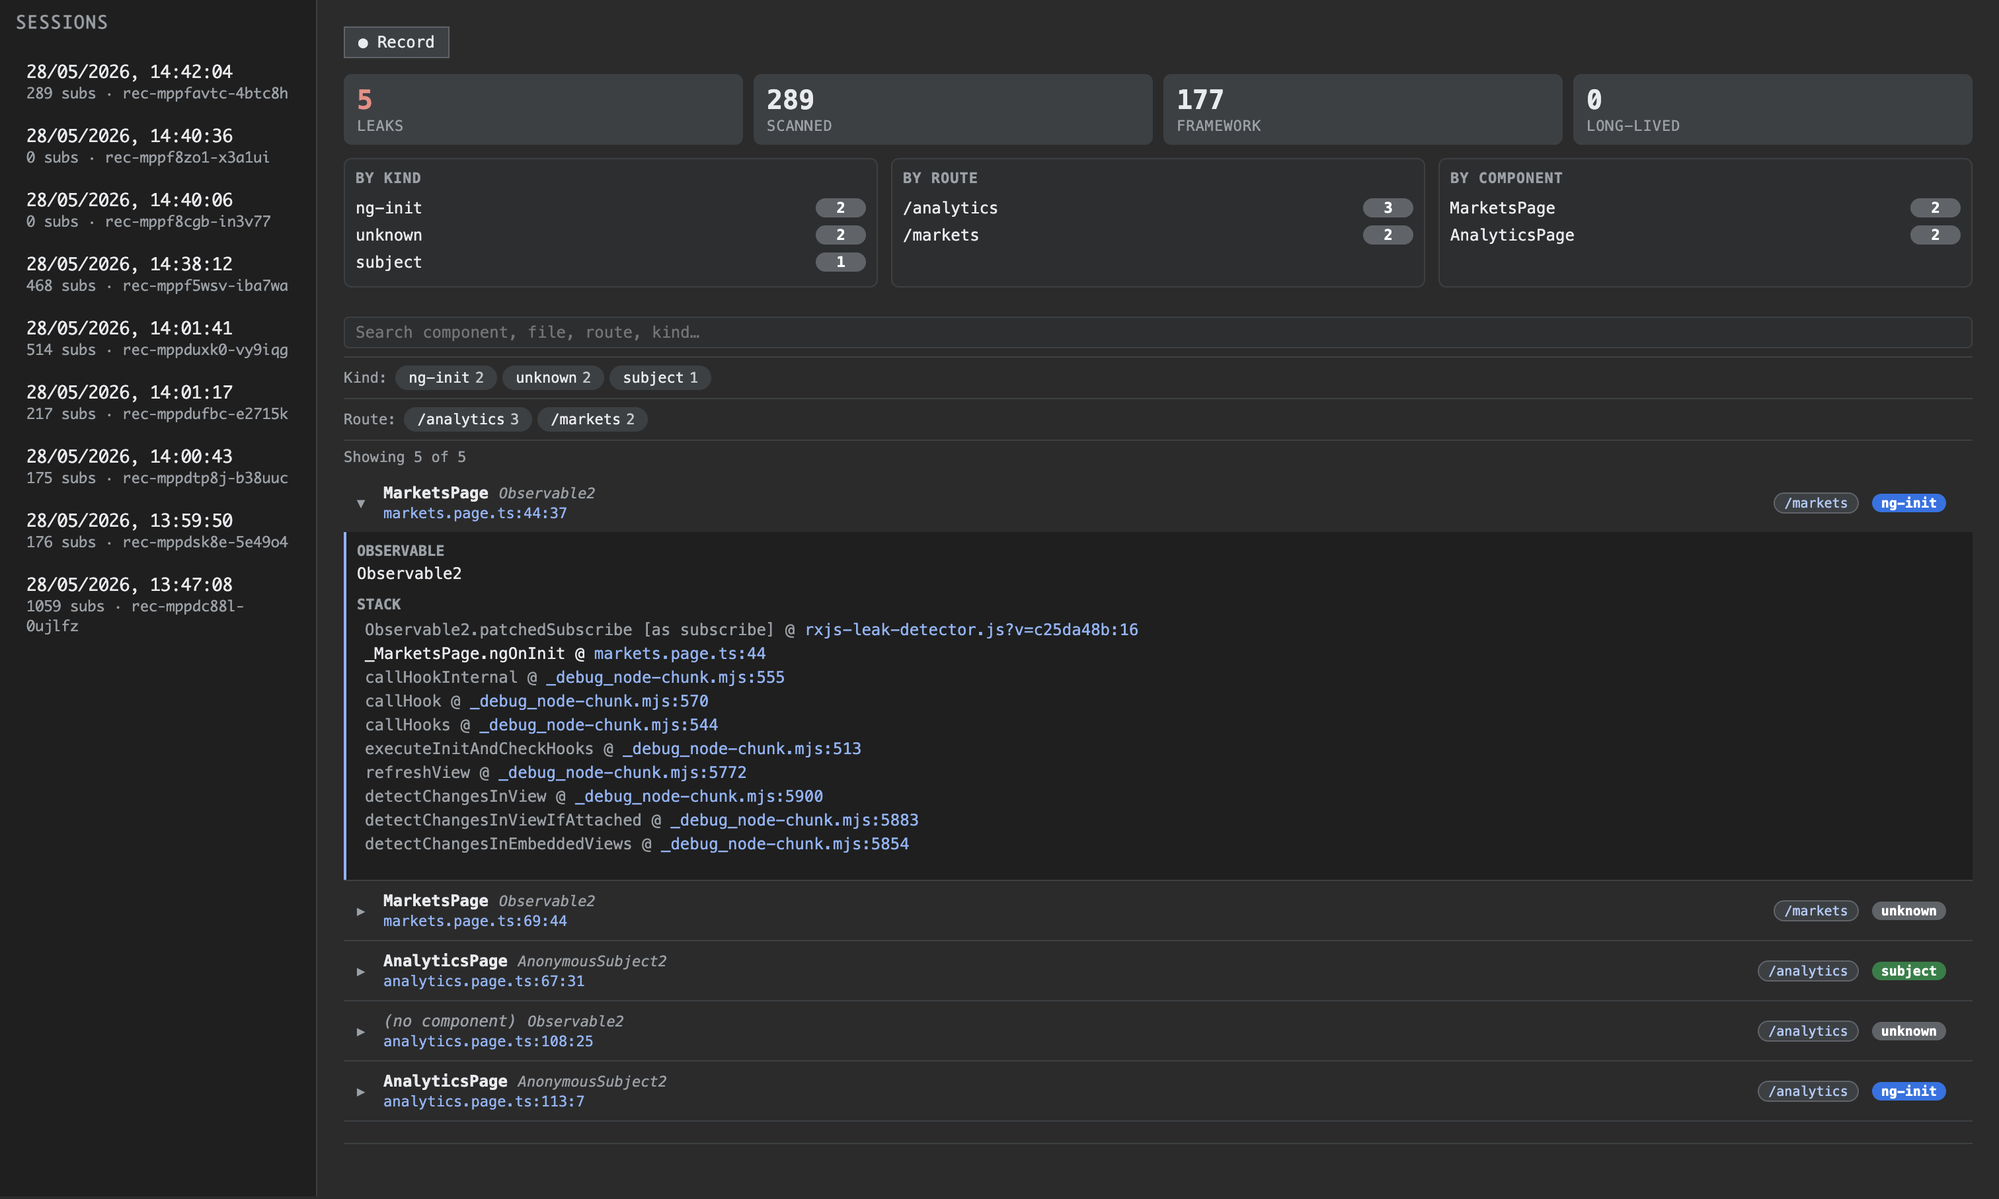
}A local dashboard, not another extension to install.
- · Live "waiting for leaks…" → candidates stream in as you navigate; Stop finalizes the report.
- · KPI cards for leaks, scanned, framework-ignored, long-lived.
- · Breakdowns by leak kind, route, and component.
- · Search and filter chips.
- · Click
file:line→ opens in your editor (VS Code, IntelliJ, …). - · Full source-mapped stack trace per leak.
How it works.
No magic, no devtools protocol, no extension. Just a stack trace, a route boundary, and a heuristic.
- Step 1
Patch
Replace Observable.prototype.subscribe to tag every Subscription with its stack at creation time.
- Step 2
Record
Track route changes via the History API. A "leak" is a subscription created on a route you've since left.
- Step 3
Analyze
Classify by stack-trace heuristics: nested, async-init, global-event, timer, subject, …
Full architecture → HOW_IT_WORKS.md
How many megabytes is each leak actually costing you?
Today the dashboard tells you which subscriptions leaked. The next release tells you how much memory each one is holding, so you can fix the biggest ones first and prove the win.
Take a heap snapshot
Right after you click Stop, the widget grabs a V8 heap snapshot of your running app — same format Chrome DevTools produces.
Walk the retainer chain
Every leaked Subscription is tagged with a hidden id, so the analyzer can find it in the snapshot and follow every object holding it alive.
Show the bytes
Each leak gets a retained-bytes column. Sort by it, see which service or closure is hoarding tens of MB, fix it, re-record, watch it drop to 0.
Read the full plan, trade-offs, and alternatives in the ROADMAP — or open an issue if you want this sooner.
FAQ
No — wrap the call in `if (isDevMode())`. The runtime is ~5 KB gzipped and inert until `enableRxjsLeakDetector` is called.